
Statistics symbols are special mathematical signs used to represent data, formulas, calculations, and relationships in statistics.
From the mean symbol (x̄) to sigma (σ) and probability signs, these symbols help students, researchers, scientists, businesses, and analysts understand data clearly and quickly.
In simple words, statistics symbols are shortcuts that make complex data easier to read, calculate, and explain.
Statistics may look confusing at first because of all the symbols and formulas, but once you understand the meaning behind each sign, the subject becomes much easier. Whether you are studying for school, working with research, or simply trying to understand graphs and surveys, learning statistics symbols is extremely useful in modern life.
What Are Statistics Symbols?
Statistics symbols are mathematical notations used in statistics to represent values, operations, and relationships within data.
These symbols help people:
- Analyze information
- Compare results
- Calculate averages
- Measure probability
- Understand trends
Instead of writing long explanations repeatedly, statisticians use symbols as a faster and clearer method of communication.
For example:
- x̄ means mean or average
- σ means standard deviation
- P means probability
These symbols are used worldwide in education, science, medicine, economics, sports, and technology.
Why Statistics Symbols Matter
Statistics symbols play an important role in data analysis and decision-making.
They help:
- Simplify calculations
- Save time
- Improve accuracy
- Create universal understanding
- Support research and predictions
Without symbols, statistical formulas would become long and difficult to read.
Imagine trying to explain a complex probability formula using only words. Symbols make the process much faster and easier.
The History of Statistics Symbols
Statistics has existed for centuries, but modern statistical symbols became more common during the 18th and 19th centuries.
Mathematicians and scientists needed a universal language to share research and calculations across countries.
Greek letters became especially popular because they:
- Were easy to recognize
- Had historical mathematical use
- Reduced confusion with regular alphabet letters
Today, statistics symbols are used globally in classrooms, scientific journals, financial reports, and research studies.
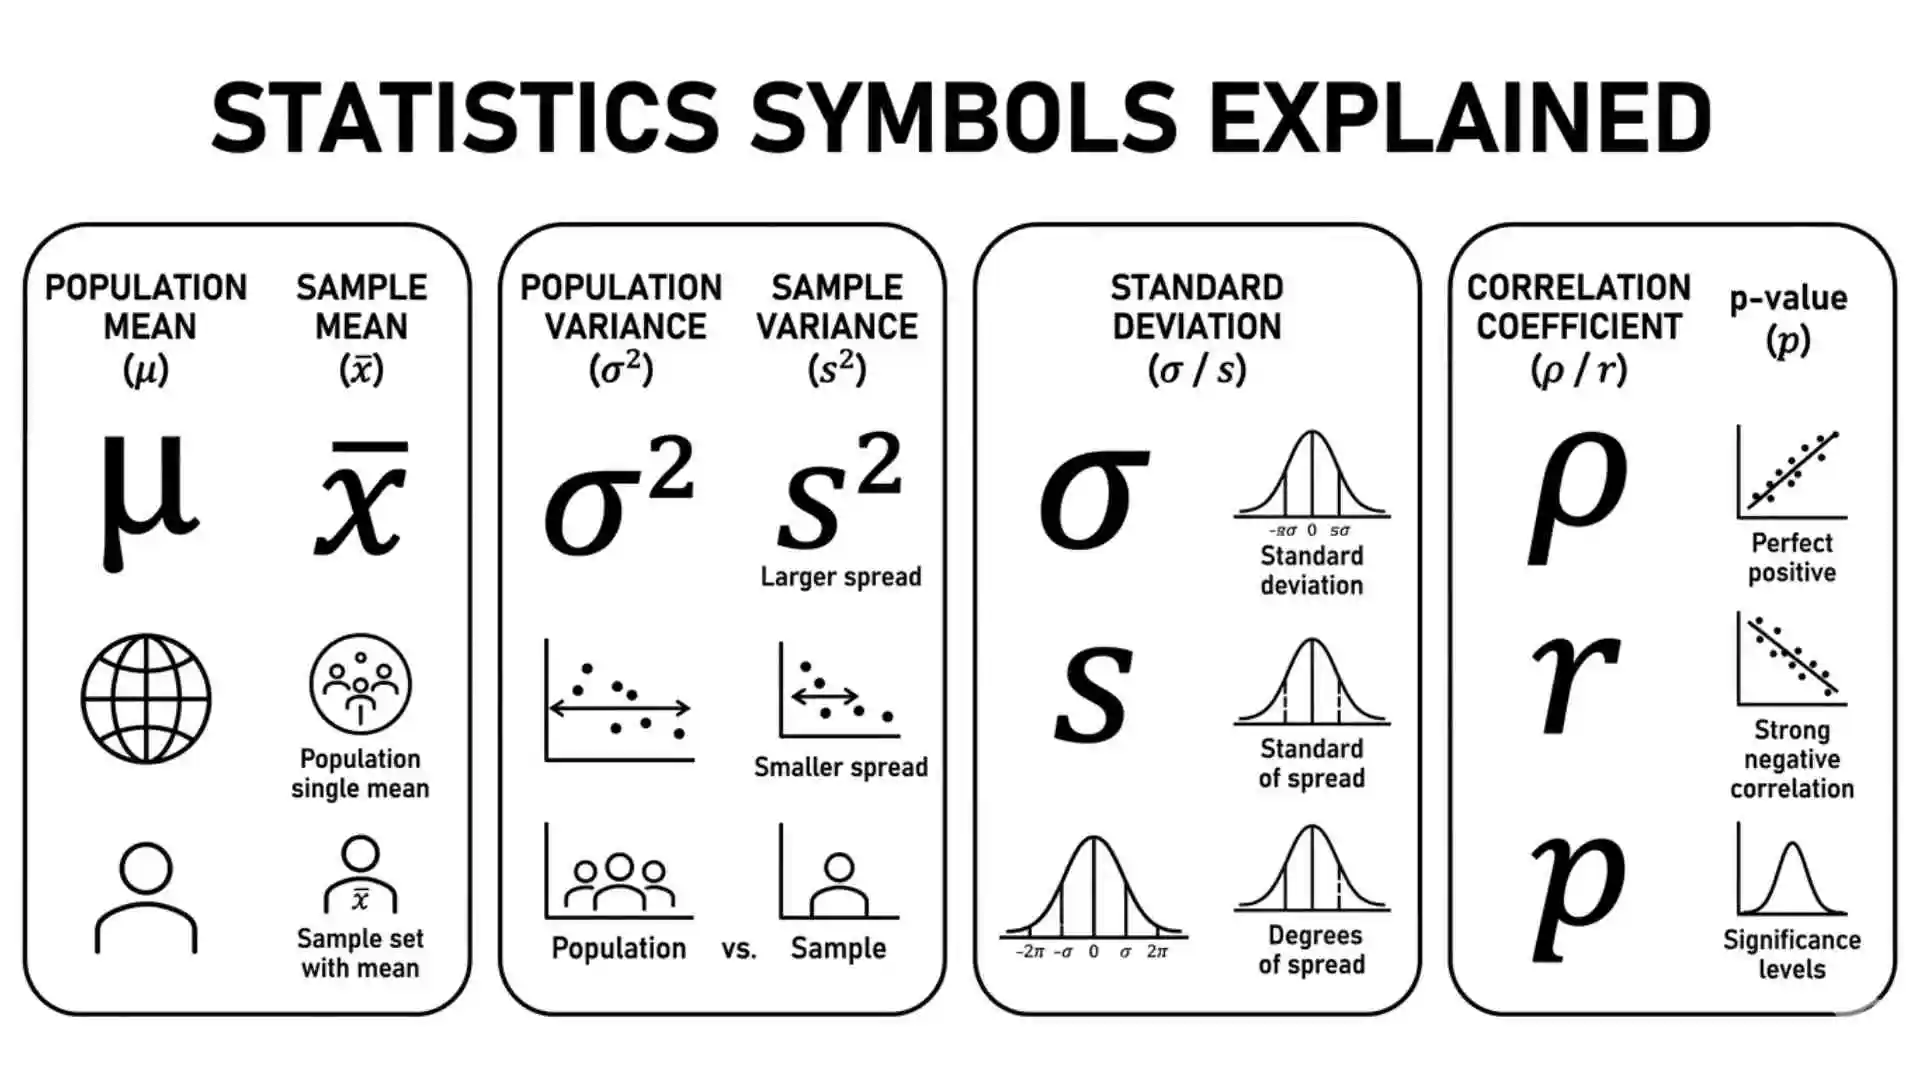
Common Statistics Symbols and Their Meanings
Mean Symbol (x̄)
The symbol x̄ is called “x-bar.”
It represents:
- The average value in a sample
Example:
If five students score 70, 80, 90, 100, and 60, the average score is represented using x̄.
Real-Life Use
Teachers use averages to calculate class performance.
Population Mean (μ)
The Greek letter μ represents:
- Population mean
Unlike x̄, which refers to a sample, μ refers to the average of an entire population.
Example
Average income of all citizens in a country.
Standard Deviation (σ)
The symbol σ represents:
- Standard deviation
It measures how spread out data values are from the average.
Simple Meaning
A small σ means values are close together.
A large σ means values are spread out.
Summation Symbol (Σ)
The capital Greek letter Σ means:
- Sum of values
It tells you to add numbers together.
Example
Σx means “add all x values.”
Probability Symbol (P)
P represents:
- Probability
It measures the chance of an event happening.
Example
P(rain) means the probability of rain.
Sample Size (n)
The lowercase n represents:
- Number of items in a sample
Example
If 50 students complete a survey, then n = 50.
Population Size (N)
The uppercase N means:
- Total population size
This includes everyone or everything being studied.
Correlation Symbol (r)
The symbol r measures:
- Correlation between two variables
It shows whether two things move together.
Example
Study time and test scores often have positive correlation.
Variance Symbol (σ²)
Variance measures how far data spreads from the average.
It is represented by:
- σ² for population variance
Percentage Symbol (%)
The % symbol represents:
- Percent or parts per hundred
Example
75% means 75 out of 100.
Basic Statistics Symbols Table
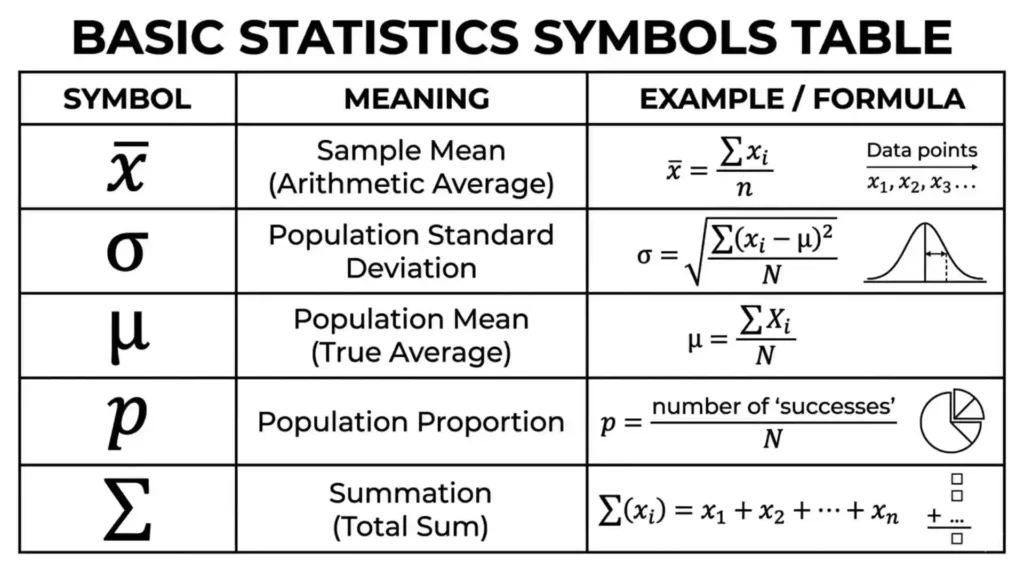
| Symbol | Meaning | Example Use |
| x̄ | Sample mean | Average test score |
| μ | Population mean | National average income |
| σ | Standard deviation | Data spread |
| Σ | Summation | Add all values |
| P | Probability | Chance of rain |
| n | Sample size | Survey participants |
| N | Population size | Total citizens |
| r | Correlation | Relationship between variables |
| % | Percentage | Exam score percentage |
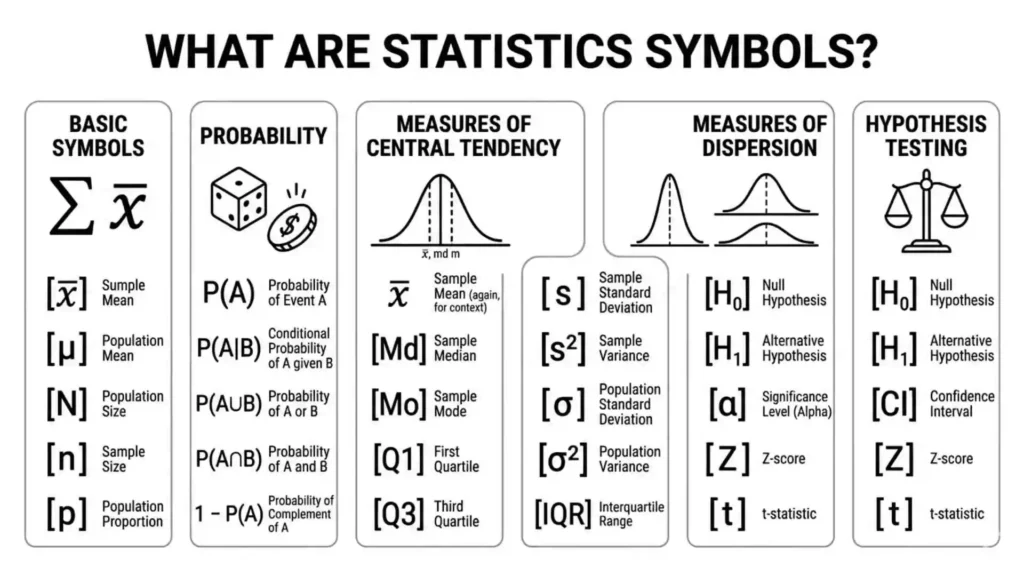
Symbols Used in Probability
Probability uses several important symbols.
∩ (Intersection)
This means:
- Both events happen
Example:
Getting a king AND a heart in cards.
∪ (Union)
This means:
- Either event happens
Example:
Rain OR snow tomorrow.
∞ (Infinity)
Represents:
- Endless or unlimited values
≈ (Approximately Equal)
Means:
- Nearly equal
Example:
π ≈ 3.14
Statistics Symbols in Real Life
Statistics symbols are not only used in classrooms.
They appear in:
- Sports analysis
- Medical research
- Business reports
- Weather forecasting
- Social media analytics
- Election polling
Statistics Symbols in Sports
Sports teams use statistics daily.
Examples include:
- Batting averages
- Player percentages
- Win probability
- Performance analysis
Analysts use symbols and formulas to compare athletes and predict outcomes.
Statistics Symbols in Healthcare
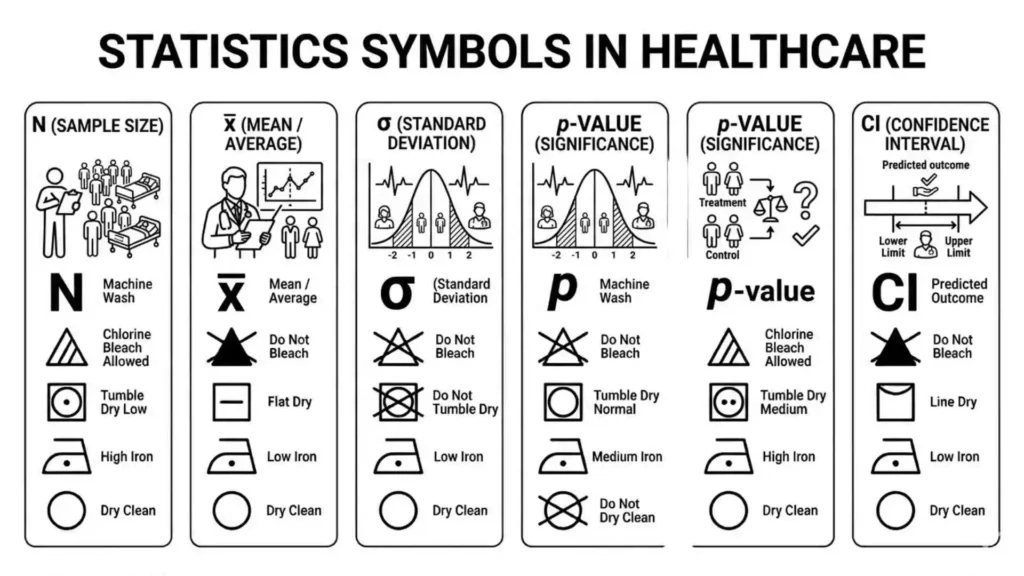
Hospitals and researchers use statistics symbols to:
- Track diseases
- Analyze treatments
- Measure success rates
- Study patient outcomes
For example:
- Probability helps estimate risks
- Averages help compare treatments
Statistics Symbols in Business
Businesses rely heavily on data.
Companies use statistics symbols for:
- Customer research
- Sales analysis
- Market predictions
- Financial planning
Data helps businesses make smarter decisions.
Statistics Symbols in Technology
Modern technology depends on statistics.
Examples include:
- Search engine algorithms
- AI predictions
- Social media trends
- Streaming recommendations
Statistics symbols help programmers and analysts understand huge amounts of data.
Why Students Struggle With Statistics Symbols
Many students find statistics confusing because:
- Symbols look unfamiliar
- Greek letters seem intimidating
- Formulas appear complicated
However, learning one symbol at a time makes statistics much easier.
The key is understanding meaning before memorizing formulas.
Easy Tips to Learn Statistics Symbols
Connect Symbols With Real Examples
Instead of memorizing symbols, connect them with real-life situations.
Example:
Think of x̄ as your class average grade.
Practice Frequently
Statistics becomes easier through repetition.
Writing formulas and solving examples improves understanding quickly.
Learn Greek Letters Slowly
Many symbols use Greek letters like:
- μ
- σ
- Σ
Learning them step by step helps reduce confusion.
Interesting Facts About Statistics Symbols
- Greek letters are widely used in mathematics and science.
- The word “statistics” comes from the Latin word “status.”
- Ancient civilizations used early forms of statistics for taxes and population counting.
- Probability theory became popular through gambling studies.
- Modern sports rely heavily on statistical analysis.
Statistics Symbols in Scientific Research
Researchers use symbols to organize and explain data clearly.
Statistics helps scientists:
- Test theories
- Compare experiments
- Predict outcomes
- Measure reliability
Without statistics, scientific progress would be much slower.
The Importance of Statistics in Society
Statistics affects everyday life more than many people realize.
It helps governments:
- Study populations
- Improve healthcare
- Plan transportation
- Understand education trends
It also helps businesses and organizations solve real-world problems.
Common Mistakes With Statistics Symbols
Mixing Population and Sample Symbols
Students often confuse:
- μ and x̄
- N and n
These symbols have different meanings.
Ignoring Symbol Definitions
A formula only makes sense if you understand the symbols inside it.
Memorizing Without Understanding
Understanding practical meaning is more helpful than pure memorization.
Statistics Symbols in Education
Teachers and universities use statistics to:
- Grade exams
- Measure learning progress
- Conduct research
- Compare educational methods
Statistics helps improve learning systems worldwide.
Famous Statisticians and Their Contributions
Karl Pearson
Karl Pearson helped develop correlation and modern statistical methods.
Ronald Fisher
Fisher improved experimental design and probability analysis.
Florence Nightingale
She used statistics to improve hospital care during war.
Her data analysis saved lives and changed healthcare forever.
Modern Uses of Statistics Symbols
Today, statistics symbols appear in:
- Data science
- Artificial intelligence
- Finance
- Medical studies
- Social media analytics
As technology grows, statistics becomes even more important.
How Statistics Symbols Help Decision-Making
Statistics helps people make informed choices.
Examples:
- Businesses study customer behavior
- Doctors analyze treatment success
- Governments track unemployment
- Athletes improve performance
Data-driven decisions are often more accurate and reliable.
Simple Statistics Formula Examples
Average Formula
xˉ=∑xn\bar{x}=\frac{\sum x}{n}xˉ=n∑x
This formula calculates the average of a sample.
Probability Formula
P(A)=Number of favorable outcomesTotal outcomesP(A)=\frac{\text{Number of favorable outcomes}}{\text{Total outcomes}}P(A)=Total outcomesNumber of favorable outcomes
This formula measures the chance of an event happening.
Standard Deviation Formula
σ=∑(x−μ)2N\sigma=\sqrt{\frac{\sum (x-\mu)^2}{N}}σ=N∑(x−μ)2
This formula measures how spread out values are from the average.
Frequently Asked Questions About Statistics Symbols
What is the most common statistics symbol?
The mean symbol x̄ is one of the most common because it represents averages used in everyday calculations.
Why are Greek letters used in statistics?
Greek letters help create a universal mathematical language and reduce confusion with normal alphabet letters.
What does σ mean in statistics?
The symbol σ represents standard deviation, which measures how spread out data values are.
Where are statistics symbols used?
Statistics symbols are used in science, medicine, sports, business, technology, education, and research.
Is statistics difficult to learn?
Statistics may seem difficult at first, but understanding symbols step by step makes learning much easier.
Conclusion
Statistics symbols are powerful tools that help people understand and organize data clearly. From classrooms and hospitals to businesses and technology companies, these symbols make modern analysis possible.
Although statistics symbols may look complicated at first, each one has a simple purpose. Learning them step by step helps students, researchers, and everyday people make better decisions and understand the world more clearly.
In today’s data-driven world, statistics symbols are not just mathematical signs they are part of the language of modern life.

Isaac Wellington
I’ve always been fascinated by the hidden stories in everyday life and the power of words to change how we see the world. Writing, for me, isn’t just a profession—it’s a way to explore human emotions, mysteries, and the unexpected twists of life. Over the years, I’ve dedicated myself to creating stories that linger in your mind long after the last page. When I’m not writing, you’ll usually find me wandering through old libraries or sketching ideas in a notebook. I believe every story has a heartbeat, and I aim to capture that rhythm in my work. Join me on a journey where imagination meets reality, and the ordinary becomes extraordinary.
Books:
-
Shadows of the Forgotten
-
Whispers Through Time